Results Dashboard
Easily create and share dynamic survey dashboards with real-time results.

Show the story in your data
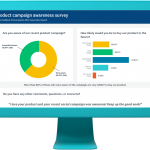
Transform your survey results into a report your stakeholders will understand. With survey dashboards, you can highlight key takeaways and even add in your own notes or recommended next steps. You can create multiple dashboards for any single survey. Plus, your dashboards dynamically stay up-to-date and can be shared with anyone via a weblink.
Focus in on key insights
By creating survey dashboards, you can easily surface the most important details for specific groups. Help your stakeholders see where and how to take action on your survey results.
Customize your dashboard
Whether it’s for your boss, colleagues, or clients, easily personalize how you share results. Filter answer data, select which questions to show, drag-and-drop charts, and customize your layout.
Save everyone time
Show your stakeholders only the information they want or need to see. Data will dynamically refresh as new results come in, so you don’t need to spend time updating static reports and presentations.

Take action on key metrics
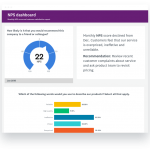
Want to monitor your Net Promoter Score®, identify its key drivers, and easily keep everyone informed along the way?
With Results Dashboards, you can:
- Filter data by month or week, and then show charts side-by-side to easily compare scores over time
- Add comments below or next to individual charts to flag changes or provide more context
- Display what delights your customers and what drives their dissatisfaction
- Customize charts and colors to personalize your dashboards
- Share your recommendations—all backed up by data—with executives, managers, or even your own team
Ready to make your own dashboard?
Give people the data they need
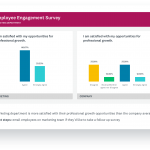
Only want to share some key findings with specific groups? Here’s how you could run a quarterly employee engagement survey across an organization and give each team actionable insights.
With Results Dashboards, you can:
- Filter data by department, team, or business unit, and create individual dashboards for any group
- Show stakeholders key points by including data on things like key attributes, such as job satisfaction
- Tailor the look and feel of your dashboards with custom colors
- Show how teams or departments compare to overall averages
- Do a side-by-side comparison of results from different time periods to see trends and changes

Ready to build your own dashboards?
その他のリソースを見る

ツールキットディレクトリ
フィードバックを自分の職務や業種で活用するためのツールキットを開拓しましょう。

アンケートテンプレート
400種類以上の専門家作成のカスタマイズ可能なアンケートテンプレート。SurveyMonkeyで優れたアンケートをすばやく作成・送信しましょう。

p値計算ツール: p値の計算方法
SurveyMonkeyのp値計算ツールでp値を計算しましょう。また、p値の計算方法や解釈方法もステップバイステップで学べます。

リクエストにお応えして複数アンケート分析機能が新登場
SurveyMonkeyの新しい複数アンケート分析機能を使うと、アンケート結果を1つのビューにまとめて分析できます。

