Are you building an inclusive workplace?
Measure what drives inclusion at your company with our expert-designed survey template.
Diversity is about more than demographics
No matter how much you focus on hiring a diverse workforce, you’re not actually moving the needle if your employees don’t feel a sense of belonging. For diversity and inclusion efforts to succeed, it’s important to look beyond demographics, using data to uncover what makes a culture truly inclusive. The data you gather can be a guide for creating an environment of inclusiveness in the workplace where all employees can thrive.
Trying to build a D&I program that supports all your employees? Our end-to-end guide includes free templates and expert advice for building an inclusive company culture.
Understand what drives inclusion
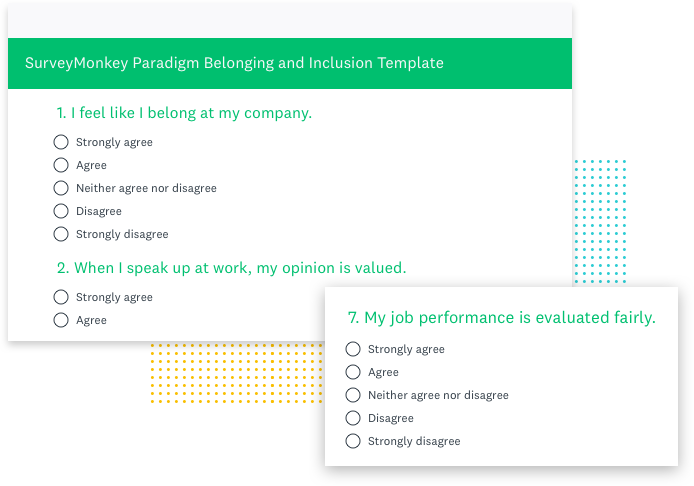
We’ve created a survey template that focuses on three key components of inclusion, each based on research by Stanford University experts Carol Dweck, Greg Walton, and Geoffrey Cohen.
- Growth Mindset: Does your company have a “Culture of Genius” that suggests talent, abilities, and intelligence are fixed traits? This can hinder feelings of belonging and growth, especially for people from underrepresented groups.
- Belonging: Feeling that you don’t belong can be incredibly taxing and is often related to social identity. How do different groups experience belonging at your company?
- Objectivity: Is there a perception in your organization that advancement isn’t based on fair and transparent criteria?
Designed by experts, backed by science
Our survey was designed in partnership with Paradigm, a leader in diversity and inclusion strategy, to help companies take a data-driven approach to measuring inclusion that draws on behavioral science.
- Vetted by survey experts: Tested with a diverse audience to comprehensively address inclusion and provide accessibility for all groups.
- Track record of success: Based on concepts proven to positively affect student wellbeing and success in school. Translated to meet requirements for the workplace.
- Measurable impact: Fight employee attrition. Our tests show a relationship between the answers to these questions and stated likelihood to stay in their job.

その他のリソースを見る

データ主導の洞察で優秀な人材を惹きつけ、士気を高め、定着させる
SurveyMonkeyのカスタマイズ可能なテンプレートで人事プロセスを合理化し、パワフルなアンケートでエンゲージメントや職場文化を改善しましょう。

従業員Net Promoter® Scoreとは?
人事担当者が従業員Net Promoter Score(eNPS)を活用して従業員の感情を明らかにし、離職率の低下や魅力的な職場環境の構築に役立てる方法をご覧ください。

学習プログラムで従業員が力を発揮できるようにする
強力なアンケートソフトで学習・能力開発の効果を測定。フィードバックを集め、成長を追跡し、長期的な成功を後押しする洞察で従業員の能力開発を改善します。

インクルージョンと所属意識アンケートソフトウェア
アンケートソフトウェアでよりインクルーシブな職場に。所属意識を測定し、正直なフィードバックを集め、すべての声を重視する企業文化を構築しましょう。
Get an end-to-end engagement solution
Build and retain a happy, healthy, effective workforce with SurveyMonkey Engage.