その他のリソース
Package Testing
Get feedback on how to quickly iterate and fine tune your package designs, planograms, and concepts to maximize overall appeal and value.


High-quality responses
Our built-in research capabilities ensure your ad and creative ideas get tested by a trusted panel of respondents.

Expert methodology
Tap into our expert methodology including benchmarking and an industry-standard monadic approach that guarantees high-quality responses.

Speed to insights
Spend less time on data analysis by reducing manual processes, like evaluating open ended responses. Take advantage of our AI-Powered Insights that create presentation-ready reports.
Get your package design concepts vetted by your target market—automatically
Rely on quality data from a trusted panel of respondents
SurveyMonkey Audience guarantees high-quality responses from millions of qualified people around the world.
Choose from more than 50 demographic parameters to create your target audience, or get even more specific by including your own custom screening question.
Panels you can trust
With SurveyMonkey Audience, your survey respondents come from our own proprietary panels and those of trusted global partners.
No bots shall pass
Our automated platform detects fraud, prevents duplicate responses, and limits survey invites and surveys per session to ensure high quality.
Truly customized targeting
Our respondents refresh their profiles regularly and you can fine tune your targeting with census balancing and custom screening questions.
See what’s included
Every project comes with out-of-the-box features such as:
- Side-by-side analysis of concept(s)
- 200 national responses with the option to refine targeting
- One custom screening question
- Monadic survey methodology and survey builder
- Up to 15 attributes for testing criteria
- Automatic fielding of your survey
- Quantitative results scorecard
- Qualitative feedback word cloud
- Option to include industry benchmarks
- Presentation-ready results, available in various formats
Concept testing helps you design packaging with confidence
Package Testing automatically compares and scores multiple packaging concepts, and provides qualitative feedback to help you identify how to design your packaging to effectively reach your target market.

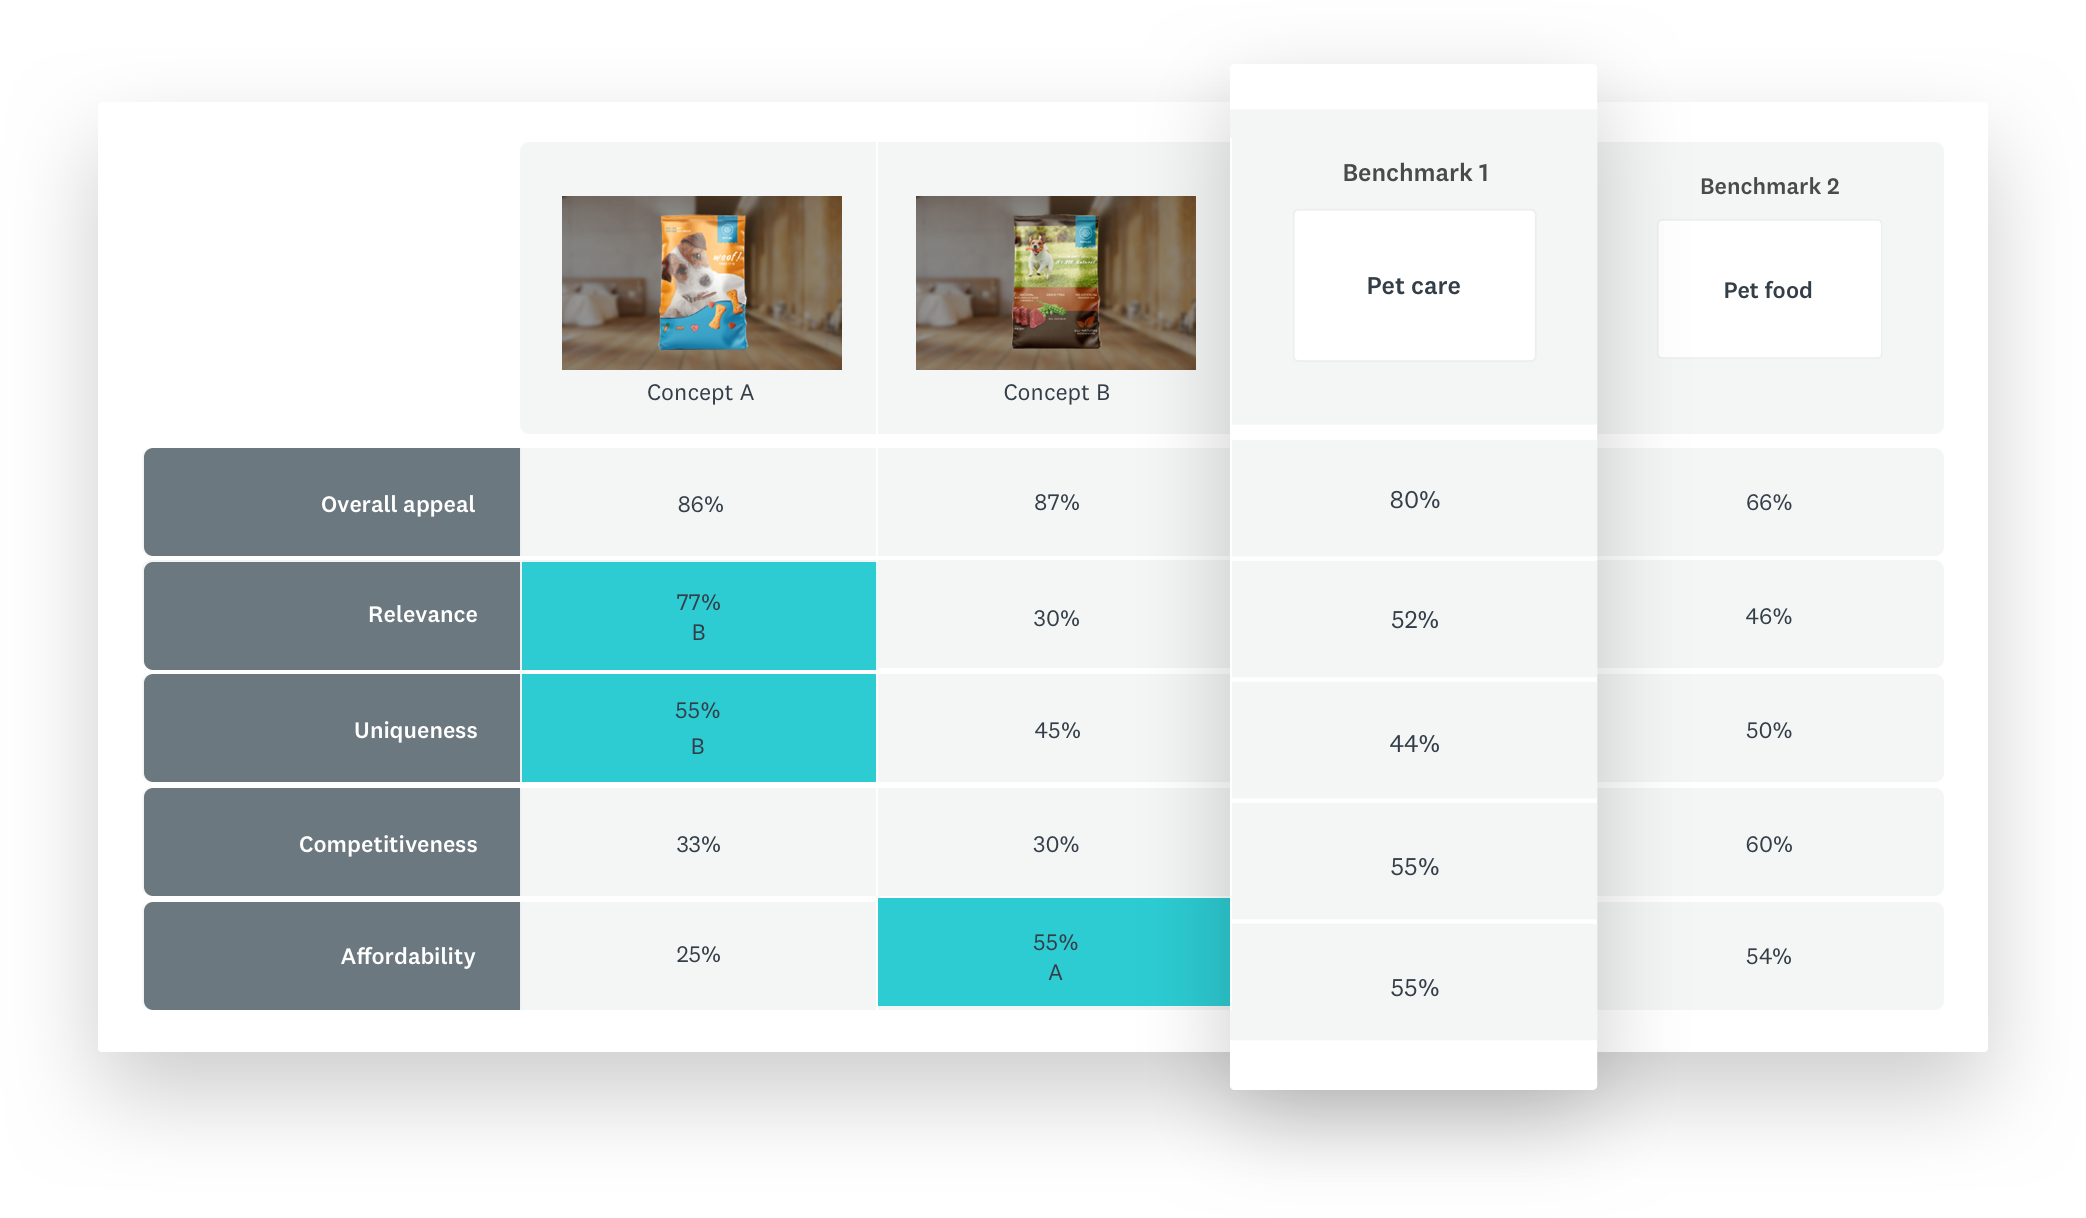
Identify which attributes for your packaging design stand out
See how your design concepts compare side by side and which are statistically significant. Customize the quantitative scorecard by choosing from 15+ attributes, or add your own.
| Impressions and feelings | Quality of information | Market fit | Qualitative feedback |
| Appeal | Clear | Affordable | First reaction |
| Eye-catching | Believable | Meets your needs | Likes |
| Stands out | Persuasive | Competitive | Dislikes |
| Innovative | Purchase frequency | What’s missing | |
| Quality | One-word description | ||
| Reliable | |||
| Unique |

Easily uncover key insights in your data
Save time on data analysis and quickly find the insights in your data. Our AI-Powered Insights uses machine learning to identify the attributes that stand out.
Get an at-a-glance view of the groups that responded well to your concepts. See which concepts won in each age bracket, income bracket, geographic location, or any other criteria you chose for your survey.
Forget manual sorting or filtering in spreadsheets; get insights quickly in a format that is easy to share.
Understand how your product packaging resonates with your audience
Get to the bottom of why your attribute scores are high or low with analysis of your responses.
- Automatically identify trends within key segments, such as how one group responds differently than your target market.
- Get AI-generated data points without having to sift through complex data.
- Highlight the most common words and phrases from open-ended questions with Word Cloud.

Learn how your packaging design performs against industry benchmarks
See if your product packaging is visually appealing, unique, and innovative compared to others in your industry.
Get polished, presentation-ready insights
You’ll get a comprehensive PowerPoint presentation of your analysis, or you can export the data to other formats such as CSV, XLS, SPSS, and more.
Find out why we’re a global leader in survey software


95% of the Fortune 500 rely on SurveyMonkey
For 20 years, SurveyMonkey has been helping more than 335,000 global organizations gather and measure feedback, so they can make better decisions and drive impact.